
The Grazier vs the Stockman
Grass is the primary resource that livestock producers must leverage in raising animals for sale, and grass production and stocking rate are the most influential variables on profitability. Successful graziers like to think of themselves more as grass farmers than stockmen - there is a clear difference in focus between the two kinds of producers:
Grass Farmers track the yield of each field at harvest. They know exactly what their paddocks yield in dry matter or animal days/hectare. Their focus is land performance, trusting animal performance to follow suit.
Stockman track breeding weights or weaning weights. They are focused on animal performance and may not have a good understanding of what their paddocks yield.
Healthy landscapes produce healthy cattle. Graziers know this and are up-levelling their grazing management with digital grazing charts for planning and decision making. This practice is the way of the future, and there are numerous reasons why.
Data That’s Easy to Read and Visually Appealing
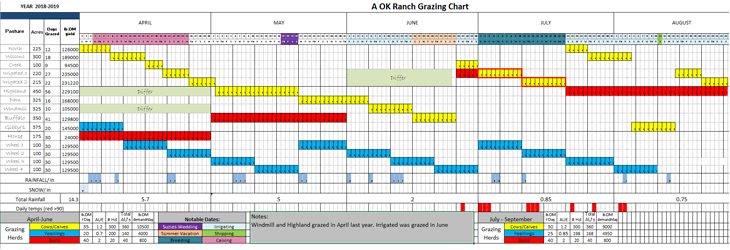
A grazing chart is your first step to a complete grazing plan. Remember, you can’t manage what you don’t first measure! There’s a lot of data involved in creating a grazing plan, and grazing charts are a wonderfully visual method for data input and quick referencing. They can auto calculate much of the data that goes into grazing planning and recordkeeping.All this data needs to be analysed, summarised and transformed into meaningful insights to make educated decisions and a new plan. Having it in digital form is critical.You may not be familiar with grazing charts, whether paper or digital. Below is an example digital grazing chart. Notice the colour coding to plan for demanding times of the year such as calving season, irrigation, breeding, as well as personal plans. Also notice the visual indication of grazing and rest periods for each pasture, and the cumulative yield (lb.DM) for each pasture.
Loads of Information in One Place that’s Easily Accessible
Bart Davidson is an Australian grazing consultant who has worked with hundreds of clients. He’s repeatedly observed that clients who use paper grazing charts struggle to recall or reference historical grazing information and metrics that would help them make more educated decisions for the future. The metric that Bart has found to be most useful to glean from grazing chart records is the feed conversion rate, or kilos of feed consumed per kilo of beef produced.“It’s imperative to know which pastures produce the most and best quality forage and the pastures that produce the least in quantity and quality. By doing this you can begin to pinpoint which pastures are making you money, which ones you break even with, and the pastures that will be losing you money,” Bart says.Bart also recommends graziers track stocking rate per acre per inch of annual rainfall. By doing this, you can clearly see how long, and by how much, you’ve been stocked above what you consider to be your safe long- term carrying capacity at average rainfall levels. This process requires a robust and adaptable record keeping system. Calculating AU’s/acre/inch involves summarising a lot of data. There isn’t enough time in the day to struggle with piles of paper records in a high performing livestock operation.Think of all the variables that go into the production of grass and its consumption rate throughout the year, and all the information you might need to make a quality grazing plan with that data:
- Historical Rainfall
- Temperature
- Nutritional demands
- Forage quality
- Livestock weights
- Paddock treatments (fertilizer, herbicide)
- Rest periods
- Graze
- Ecological concerns
- Season of use
- Targeted grazing priorities
Many of these variables can be tracked and accounted for in a digital grazing chart, like the above example, using Microsoft Excel or GoogleSheets. One helpful tip is to lightly shade or black out paddocks during the mandatory rest period, or during periods of ecological concern. For example, sometimes it’s not wise to graze the same paddock at the same time every year when trying to increase biodiversity. You can easily mark these critical periods and ecological concerns on your grazing chart.

“Think of each pasture as a grass factory. Use your grazing chart to identify best, worst and average, then manage accordingly.” – Bart Davidson, MaiaGrazing Ag Consultant
A Valuable Part of any Grazing Plan
A grazing plan is the best prediction of what you expect, or hope, will happen in the upcoming months. It will reveal your current inventory, resource concerns and conservation efforts, seasonal forage production and use projections, residual grass cover, management activities (and the dates they should occur), personal and family commitments and critical livestock welfare periods. It should include key metrics that monitor progress toward goals such as dry matter yield and residual per acre, and stocking rate per acre per inch of rainfall, as mentioned earlier.Ray Archuleta, “the soil guy”, once said: “Our lakes and rivers are filled with nutrient, grazing, and conservation plans, and not crystal clear with understanding. You’ve got to understand; conservation planning is not the goal, it’s the process.” Rarely do things go according to plan, especially in livestock farming, causing many to give up on planning altogether. The value in a grazing plan is not just in the plan itself, it’s also in the process of making the plan. A plan brings you clarity about your current position under the present conditions. When conditions change, you can then better adjust and re-plan with greater clarity and predictability.

Save Time in Re-Planning

If the process of planning is critical, it seems that ease of re-planning must be equally important. Doing all of this with pencil and calculator is time consuming and too cumbersome to carry out for long periods of time. Digital grazing charts are much easier to manipulate to match constantly changing conditions. Imagine a scenario with a paper grazing chart where you have an entire pasture consumed by a wildfire. Now, to create a new plan you must bring out a blank grazing chart and re-create the entire thing by hand to account for one pasture being removed from the rotation. With a digital grazing chart, everything can easily be manipulated without starting from scratch.The graphic above helps illustrate the purpose of a grazing chart in the scope of a well-managed operation.
- Create a digital grazing chart as part of your grazing plan and keep a record of what happened on another copy
- Keep your original chart intact as you may want to reference it
- At the close of each year, summarize the key metrics you’ve chosen to measure and
Even the best laid plans can be disrupted. From weather events to external market forces, plans constantly change. Their value is in the decisions that come as a result of the planning and re-planning. With a solid and digitized system in place, you’ll be strategizing, and record keeping on-the-go, with a clear idea of your current position and the resources available to you. The hardest step is just getting started. It takes time to establish new systems, but they will ultimately save you time and pay you dividends in the future.


