
Grazing Charts are an Essential Planning Tool for Any Grazing Business
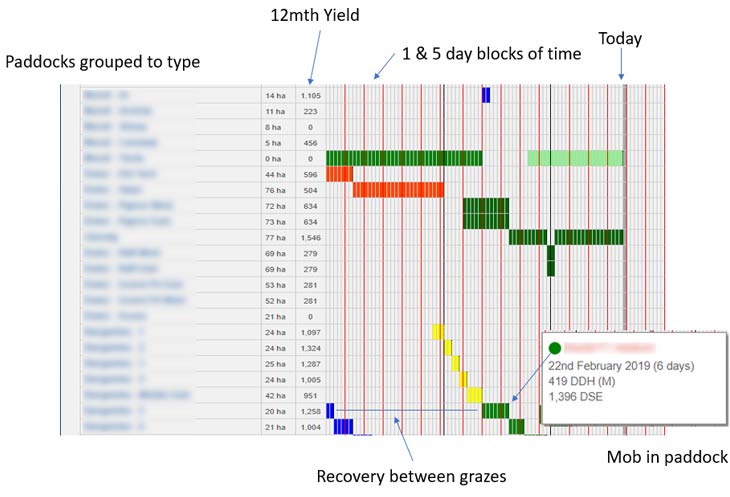
A grazing chart is simply the visual representation of animals moving through the property over time. Days on the x axis and groups of paddocks on the y-axis, colors per animal group per day per graze. Take out the mystic rural affinity and a grazing business is like any other. It’s a sausage machine that must produce something.
We all agree it can be challenging. To convert an unpredictable outcome of weather (i.e., rain) into a perishable ingredient (dry matter in forage). All via a wildly variable substrate (soil) to make products with variable quality into a market with significant volatility. Explaining this to a mechanical engineer with 2% tolerance for variation makes it obvious how many vagaries there are in grazing versus most other production businesses.
"The job of a grazier is to convert precipitation into grass and grass into production, everything else is noise, culture, habit, love for animals and machinery." Bart Davidson.
Every business is about supply and demand, and a grazing enterprise is no different. In a grazing business it can be difficult to know future grass supply. However, we can all learn to guesstimate current feed available and current demand (i.e. the daily feed demand for all the mouths we have on now). It’s unlikely we will learn where we’re at with grass supply and demand without a feedback loop to learn from. Very intuitive observers of grass, animals, time, season and land type, can do something the other 95% of us simply cannot.
This is the ability to:
- Carry around in their heads an accumulation of numbers and changes, or;
- They use a grazing chart.
Many do both, simply to make it easier. they use a grazing chart. Many do both simply to make it easier.
The Power of a Grazing Chart to Unlock the Information in Your Property
Running a grazing chart is like opening a whole new folder full of information about your property. Information you didn’t know existed. For example:
- Paddock yield, in a graze, a month, a season or a year. Very important to decision making!
- In the past, how you came up with prioritising where to fertilise and what the return was.
- What method was used to compare the performance of different soil or feed types.
- How to track change in trend over time and get a sense of progress or decline.
How on earth can you make those decisions without knowing the monthly or annual yield of the primary ingredient consumed in your production system, aka grass? It's kind of frightening when you consider the amount of money invested in seed, fertilizer, chemical, sub-division etc to do with property development and improvement. Compared to cropping where it is well known.
Stop and think about the primary difference between cropping and grazing. As well as why croppers will know the yield per area per crop. This is the case because it’s how they get paid. Whereas in grazing, we get paid from the conversion of dry matter into animal production. With the result graziers don’t know the forage yield per paddock nor how well it was converted into beef, wool, etc by the animal. Hence the efficiency of this animal or pasture type.
Running a grazing chart can resolve these issues. It is so easy to do that the benefits outweigh the time cost and the time will be recouped by making better decisions. So, you spend less time keeping busy fixing problems. It’s a win win, as they say.
Tracking yield is as simple as tracking animal movements when the math is done for you in a digital grazing chart
How can we run a grazing business, worth a small fortune in land and livestock asset values? Without knowing or having some vague idea about the actual ongoing yield per paddock and if what we are doing is working. 1 mob or 50, how do you balance the competing needs of individual animals for daily nutrition needs (versus pasture needs for recovery and re-grazing to optimize regrowth).
Most graziers will tell you they don’t know grass yield because they are still calculating livestock inventory, let alone grass inventory and yield per graze. They will say it’s too hard and to ignore it. The old chestnut ‘you can’t manage what you can’t measure’ applies here. What’s even better is that livestock measure it for you. We don’t have to measure yield. Our collection of four-legged two stomach one mouth mobile harvesting unit does it for us!
All we must do is keep track of:
- where they are now,
- when we move them to fresh pasture, and
- when their feed demand changes as stock class changes with weight gain, lactation, etc.
But only if we are using a Grazing Chart. Techno high density down to set stocking, a grazing chart provides value regardless of the style of grazing. Learn why you should switch to a digital grazing chart.
Let’s get a few things straight about grazing charts
- Using a grazing chart does not mean you graze in any particular way. However, it tends to result in greater consideration and awareness for allowing recovery into your thinking. Among many other benefits.
- Whether you graze in a set stocking pattern for some or all animals or visa versa with short duration high impact rotational grazing. A grazing chart can keep record because the style does not affect the data record being kept. It will presumably have different impact in the paddock, but that is the point. Having yield records for these differences makes it easy to compare actual yield within and between paddocks. Discerning these differences and impact on production over time.
- Grazing is harvesting, it is not passive. So, lowering the stocking rate per paddock does not change the amount an animal needs to eat, it is just less obvious.
- If we know the graze, we know the yield harvested. Each day (if we want) or per graze, per month or per year time period.
- A grazing chart that is just used to record the past will not result in better decisions.
Our purpose
Let’s regroup for a moment and remind ourselves of what we are trying to achieve in grazing. Our goal is to:
- Make better decisions. About how much to graze, how long is enough recovery, how many stock. Also, when to pass through lightly versus increase graze density, which paddock sequence to follow;
- Balance supply and demand not just today with one Mob but making sure I have enough feed for all animals for the next 100-150+ days. As I can ‘see’ who is getting what, across the farm, and over months into the future;
- Get the right feed into the right animal. We don’t feed our growing teenagers what we feed grandpa without any teeth do we? Animal performance matters and that means who we give what feed at what stage of the year matters;
- Learn and optimise pasture recovery periods and graze density
- Keep it practical and manageable for the people doing the doing. While also recording it so everyone is happy with the result. Not everyone gets the same kick out of doing a move on Sunday afternoons!
Reading up on the RCS 6 Regenerative Grazing Principles is highly recommended as a reference for grazing principles.

Benefits of a grazing chart
Grazing is a dance between the weather. The soil that converts rain to grass and the animals convert that grass to a product. That’s hard enough for anyone. So, without a grazing chart you won’t be able to carry around the numbers in your head.
The benefits of grazing charts include:
- A feedback loop. It becomes clear when we go back into a pasture too soon or leave it too long. Or when we could have increased the head count per area or used a different class of stock to improve weight gain. The feedback loop goes constantly.
- A measure of soil and pasture species performance to get return on investment from interventions with cost. Such as fencing subdivisions, adding water points, switching seed, using or changing fertiliser.
- The patterns of grazing we forget or are not aware of become clear in the results of a grazing chart. We can then correlate to any change in ground cover, species diversity, root depth, water infiltration, etc.
- Learning the individual rhythm each paddock and land area on a farm has. Their different capacity to recover from grazing becomes clearer when we can see it on the chart.
- Dealing with what’s in front of us is as important as anything else. As people we go from flat out ‘hoping’ for rain or some heavenly intervention to being in control.
- Grass as an inventory we can allocate out over time. This puts it on the farm balance sheet where it belongs instead of an assumed intangible that arrives in time (or not).
- Strengthens the relationship between people (the eyes in the paddock), livestock and pasture. Since it is after all a 3-way deal. All three need to be fed and rewarded for doing well.
- A reference to learn from and refine. Be brilliant at the basics and the complicated becomes simple!
- A digital grazing chart overcomes the need for manual calculations that make paper charts too time consuming for some. It removes the pain of using a calculator every graze.
If you are using MaiaGrazingLITE then you have not yet seen the MaiaGrazing Chart and probably should. If you are using paper grazing charts and want to go digital to share it with the team, take a look at MaiaGrazingPRO. It’s not laborious to get going with a grazing chart. Start recording moves as they happen and MaiaGrazing will do the rest. Then we can talk about planning, analytics and forecasting to leverage the data in future articles.

